Setup
using my TradingView High Dividend Yield Trending Canadian Stocks Screener, I discovered North American Financial 15 Split Corp. It’s paying about 10% div and pretty reliable trend. My plan is to collect the dividends even if the capital gain moves slowly up.

Entry
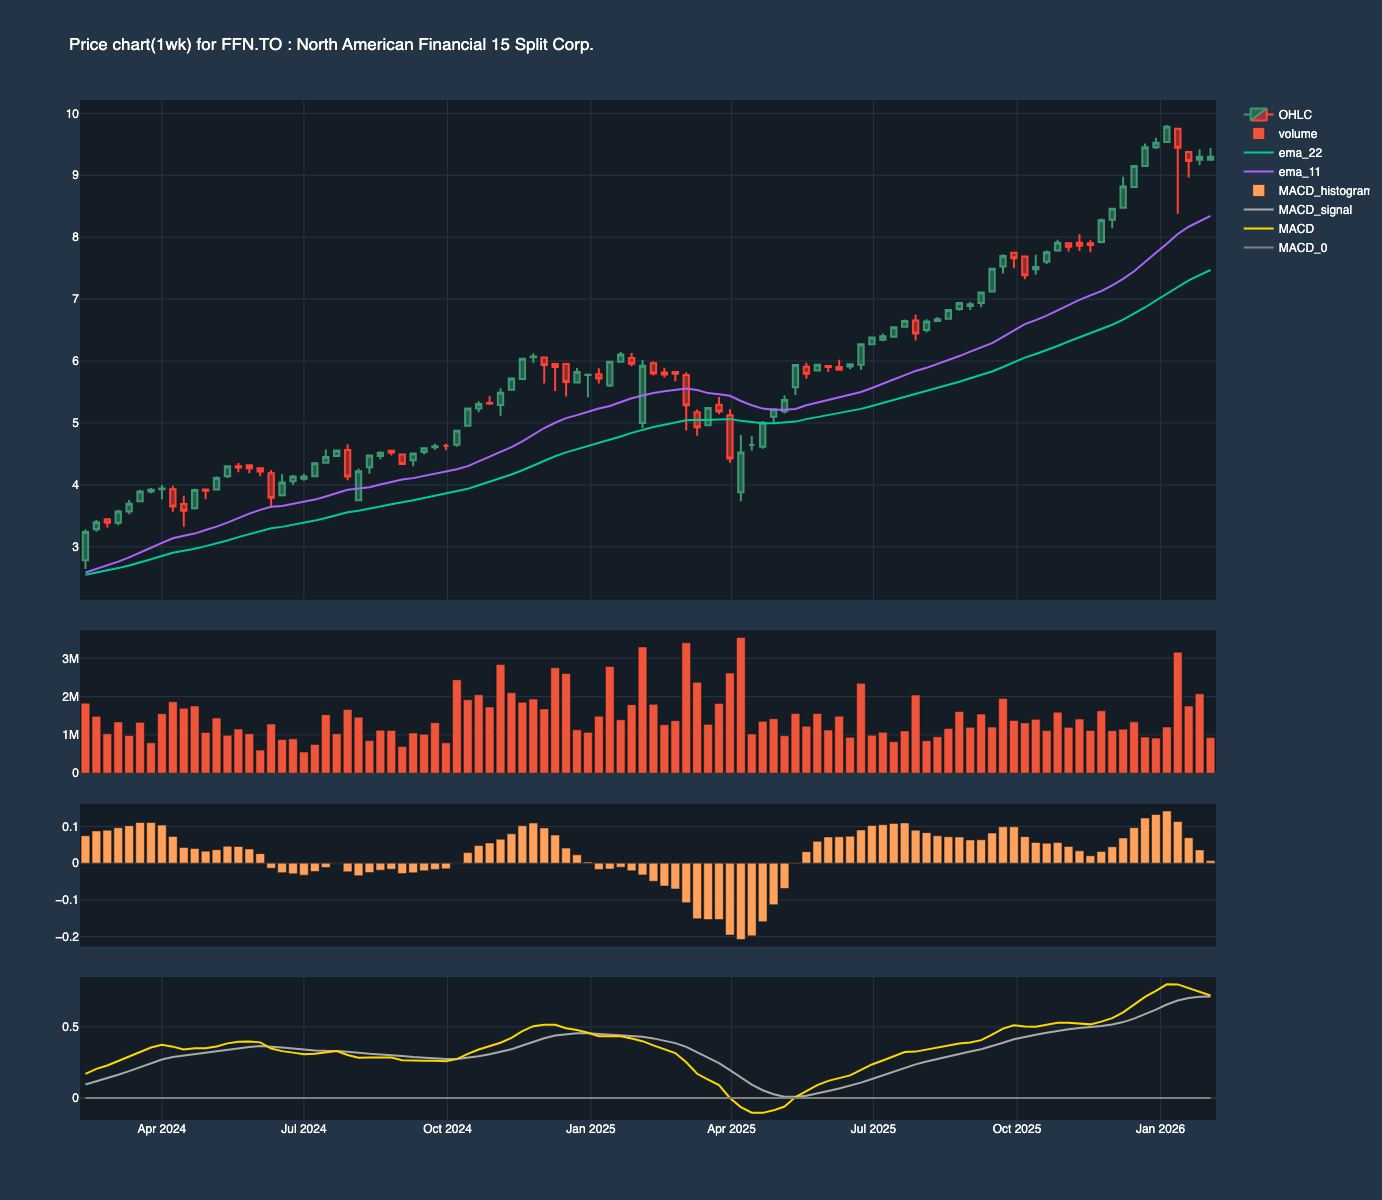
Entering at the level of the fast EMA and stop at the slow EMA on the low set on 2026-01-26 (8.931) with about $100 at risk:
- Bot 100 shares @ 9.27 on 2026-02-02
- Bot 100 shares @ 9.30 on 2026-02-05
- Bot 100 shares @ 9.28 on 2026-02-05

Updates
2026-02-16
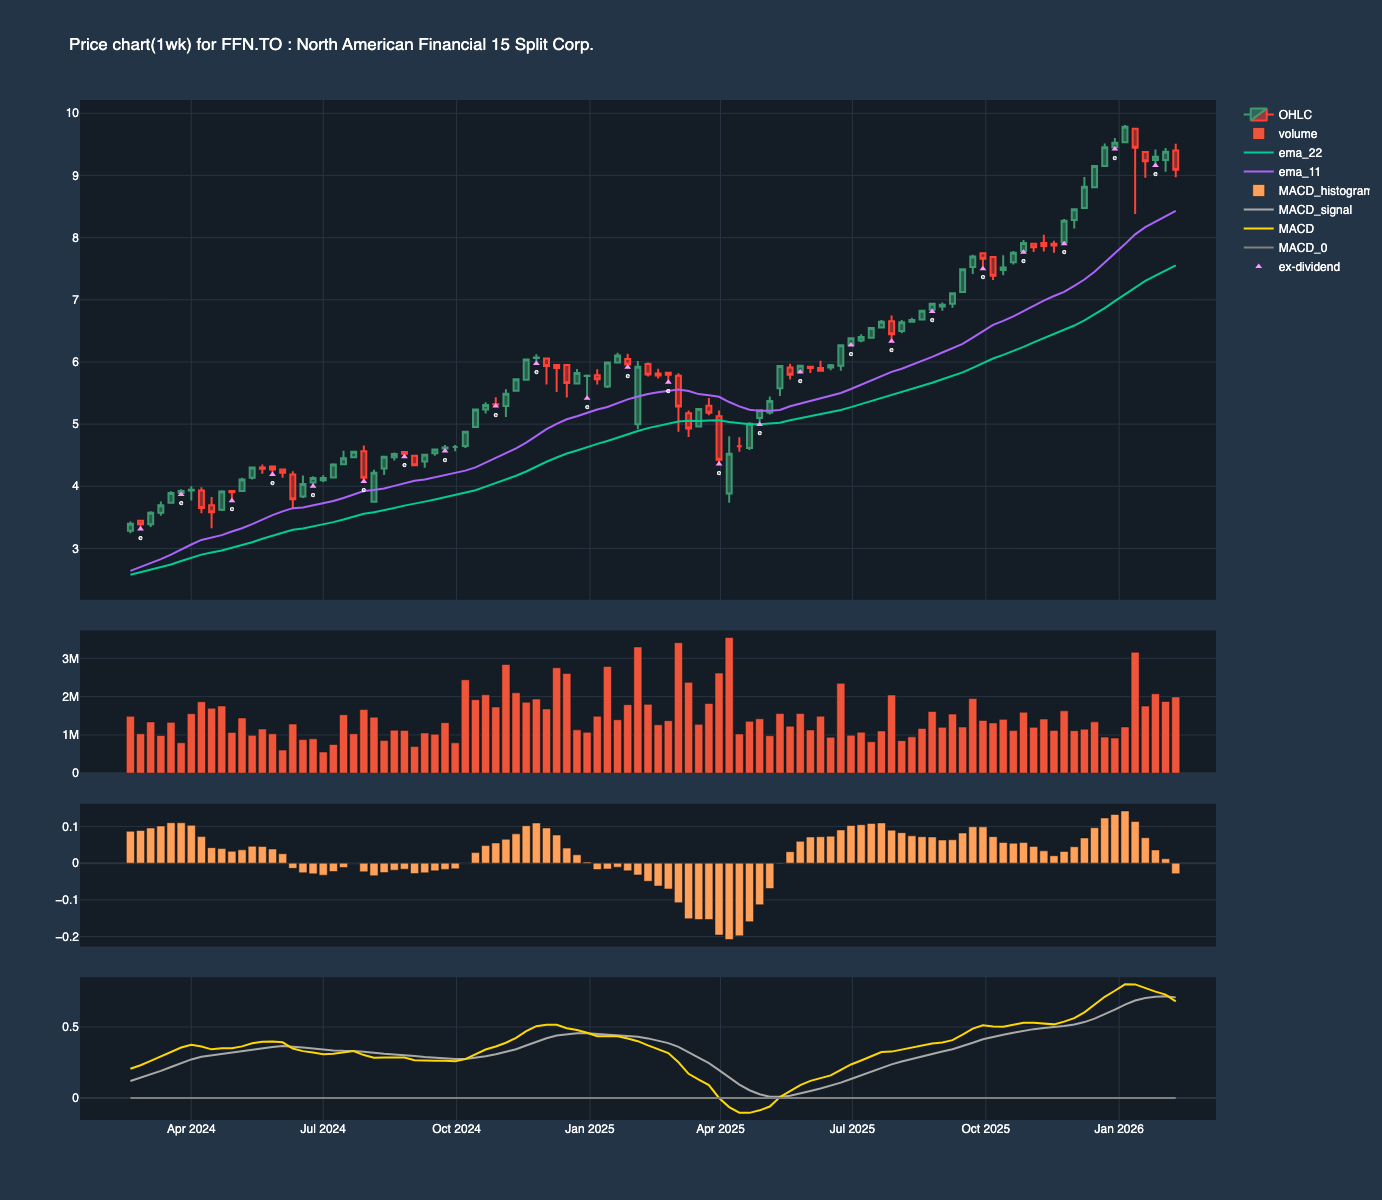
pretty rocky week with 2026-02-13’s low of 8.97 almost triggering our stop at 8.93. The weekly chart Figure 2 also shows that the weekly MACD just turned negative. This stock seems to move with XIU.TO.

2026-02-25
Two days to ex-dividend (0.113/share) and the stock’s back in the “value zone” again. But this stock is looking more and more like BBD-A.TO and BK.TO, when they ran out of steam and broke thru support. So instead of adding to this, I might want to add to LBS.TO instead.

Stop
hit stop of 8.93 on 2026-03-02
Sold 300 shares at 8.93, loss: 106 CAD

Learning
while on paper this was a 106 CAD loss, we did capture a sizible dividend of 0.11/share that went ex on 2026-02-272 so our actual loss is only about 73CAD after adding back in the 33CAD of dividend we collected.
This trade is a positive data point in our experiment of buying high dividend paying stocks that are in long-term uptrend. The risk in the play for capital gain is reduced by dividend payments, especially during long holding period.
in addition, some general truth/ wisdom/ unteachable lessons was learnt from this trade:
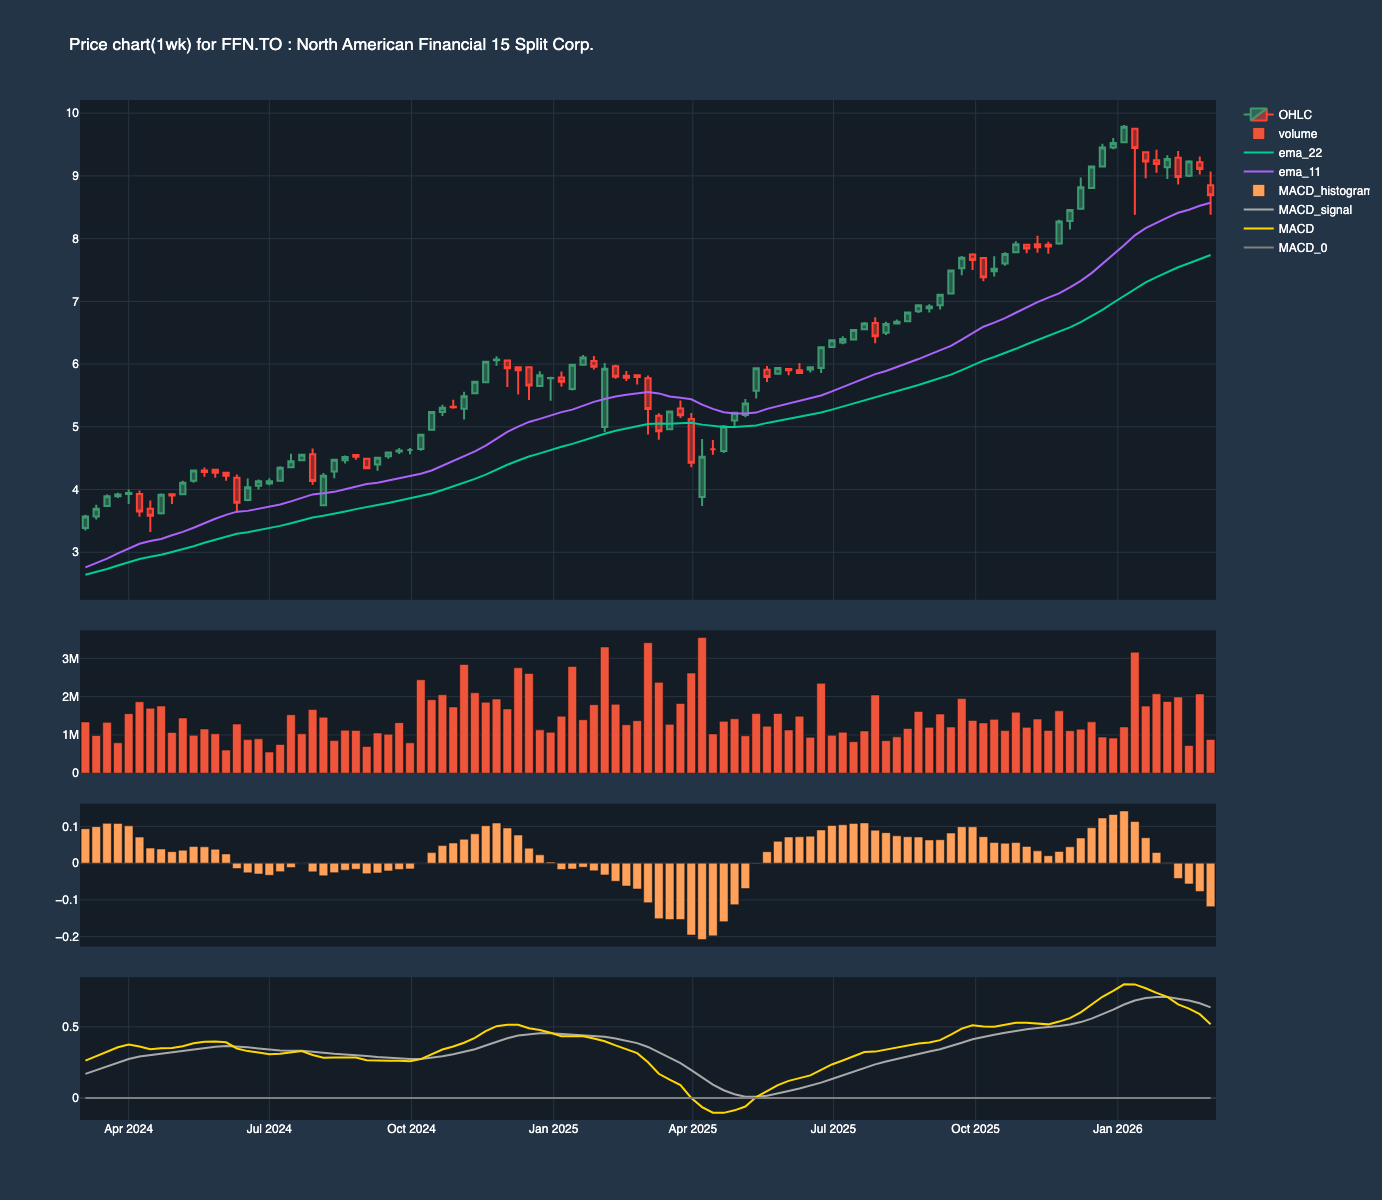
- if a trade is taking a while to turn profitable, it’s most likely a losing trade (that is the wisdom in timed-stops). As Figure 3 shown, the stock has been stuck in the “value zone” since it was opened.
- respect exit rule: a second sign for heading for an early exit was when MACD histogram turned negative on the weekly chart Figure 2 indicating a potential stop to our “long-term uptrend”